With the introduction of the new Metrics module, collecting your data has become even easier. The module allows you to use formulas, create graphs and charts effortlessly and integrate them directly into your sustainability report. In addition, sample tables are available for each ESRS, GRI and DNK indicator to help you collect the required data quickly and efficiently.
If you have previously used the "Key figures" module for this purpose, you can continue to use the key figures module. The functions of both modules are available and if you switch from the key figures module to the metrics module, your previously recorded data will not be deleted.
How to fill in metrics
If your system has recently been equipped with the ESRS reporting standard, you will already find a structure in the metrics overview that offers ready-made metrics with fill-in aids in tabular form.
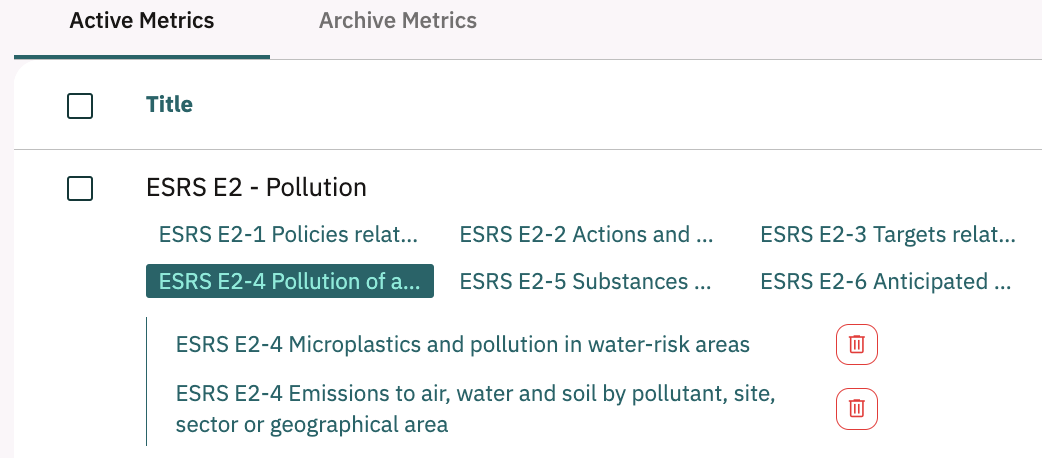
-
Data entry
Navigate to your desired indicator and click on the corresponding metric.First tab
Here you will find detailed help and instructions on how to fill in the metric according to the standard.
Second tabYou can enter your data in this tab. You will receive a sample table whose structure you can use for your data. Use the full-screen function to get a better overview of your data.
Further information on the corresponding indicator is available via the page navigation.
-
Creating diagrams and graphs
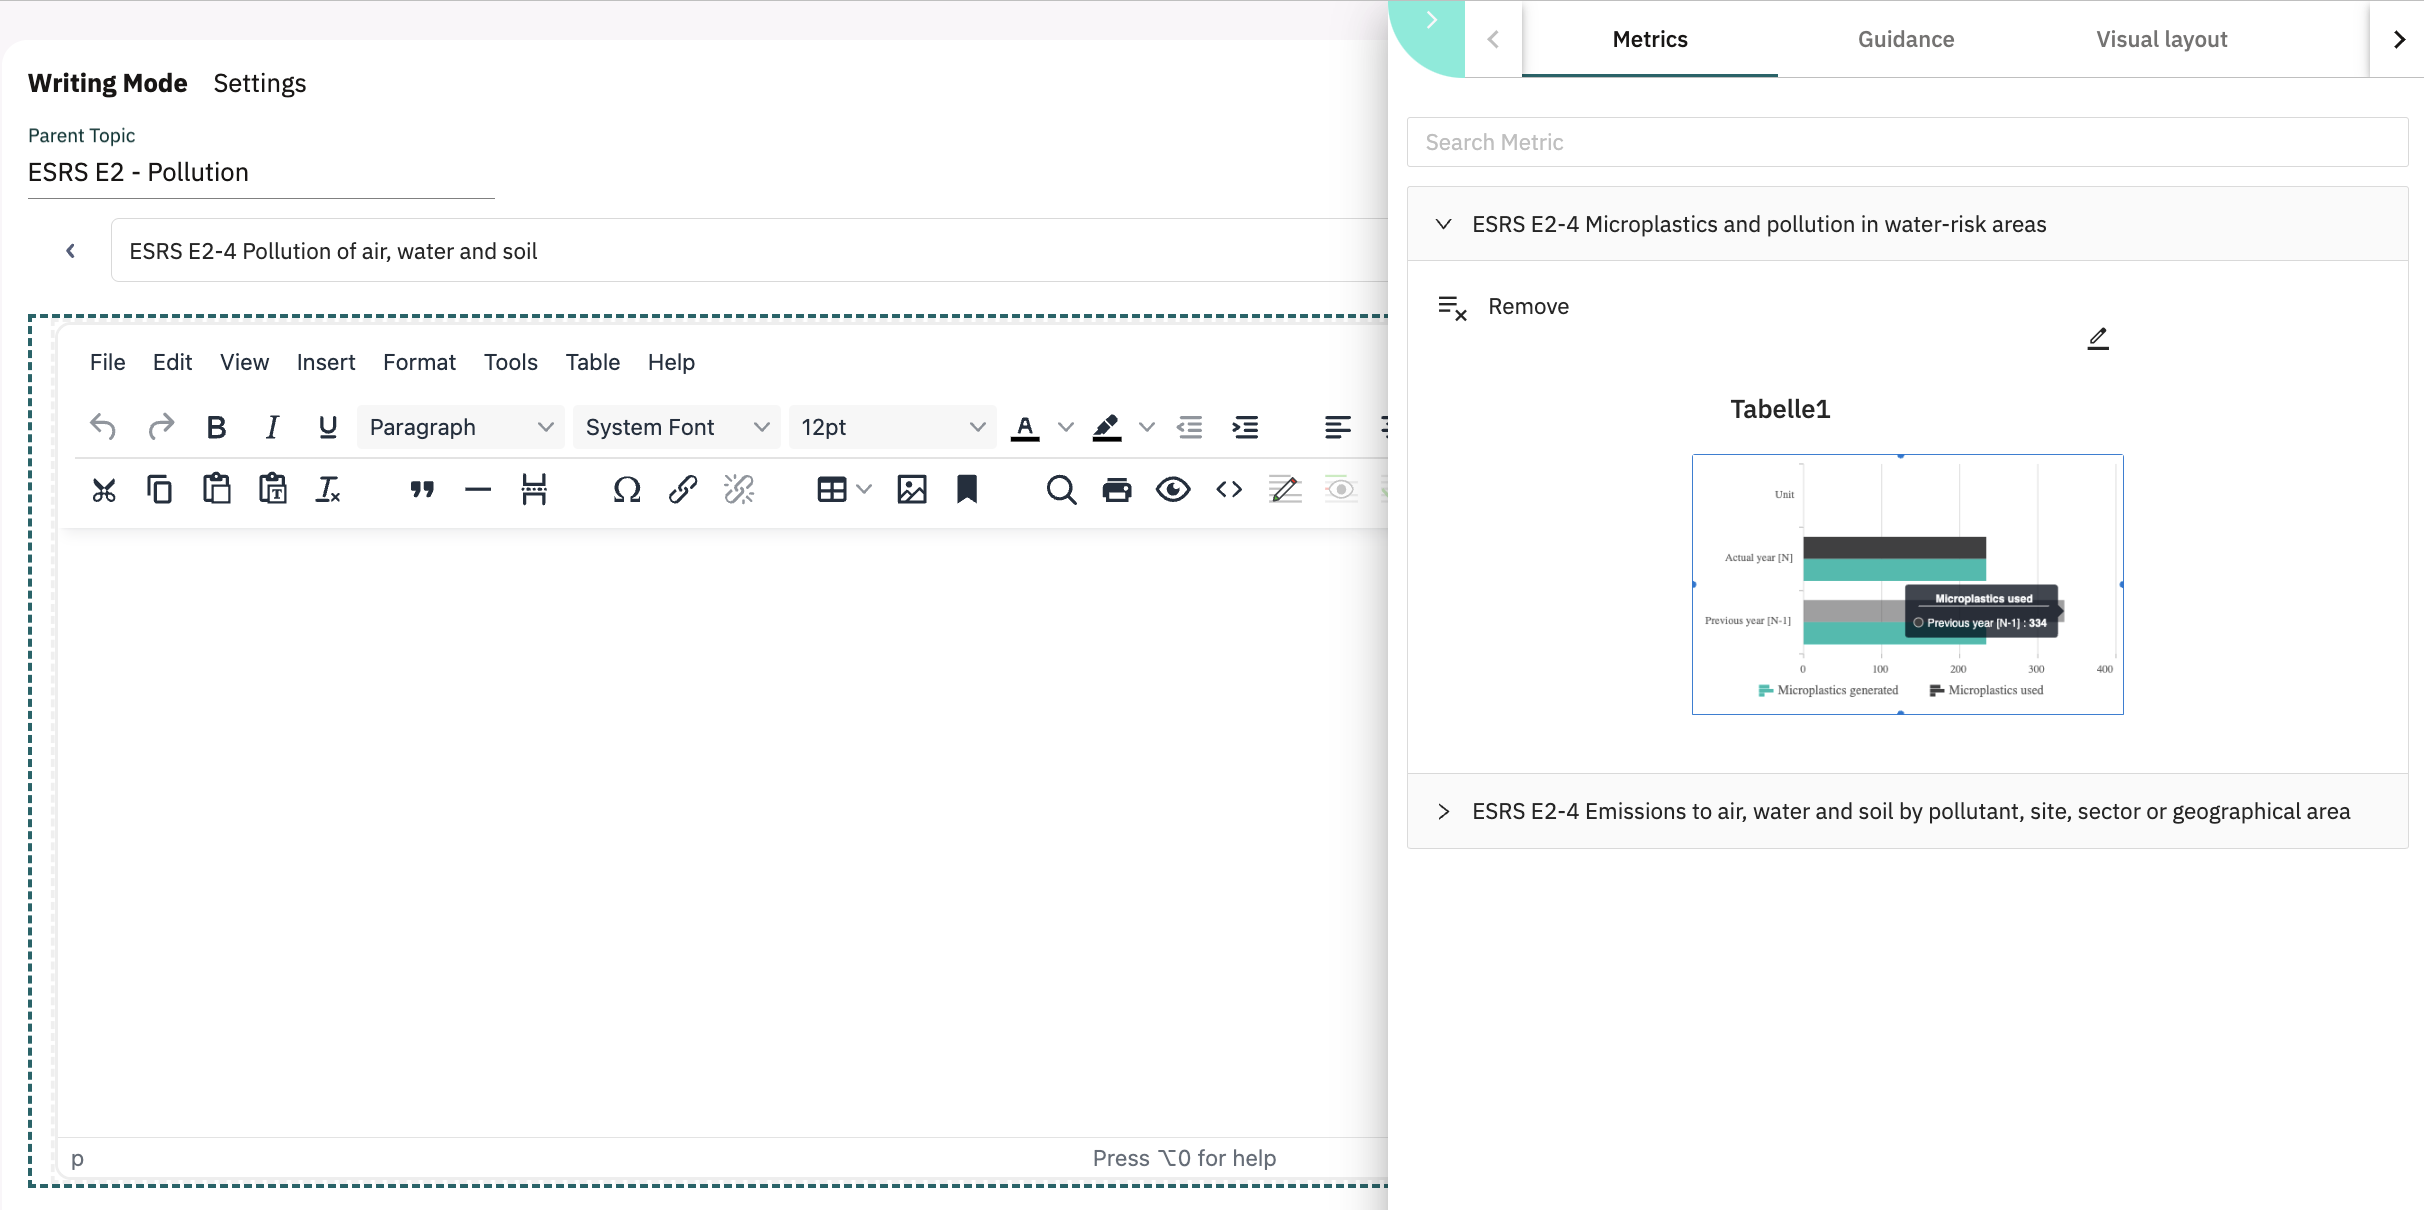
Create diagrams and graphs from your entered data. Use the functions provided above the table - also to visualize your table or to use calculation formulas.
When creating your report, you can easily access the charts you have created by using the page navigator of the corresponding topic.
-
Adding new metrics
You can also create your own new (="empty") metrics for a topic or indicator using the "Add" button on the metrics overview. For this to be displayed in the overview, it must be assigned to an existing topic.
The linked topic or indicator now appears in the overview and you can access an empty representation of your metric via the "Add new metric" button. Now give your metric a name and save your content.
Data entry
Navigate to your desired indicator and click on the corresponding metric.
First tab
Here you will find detailed help and instructions on how to fill in the metric according to the standard.
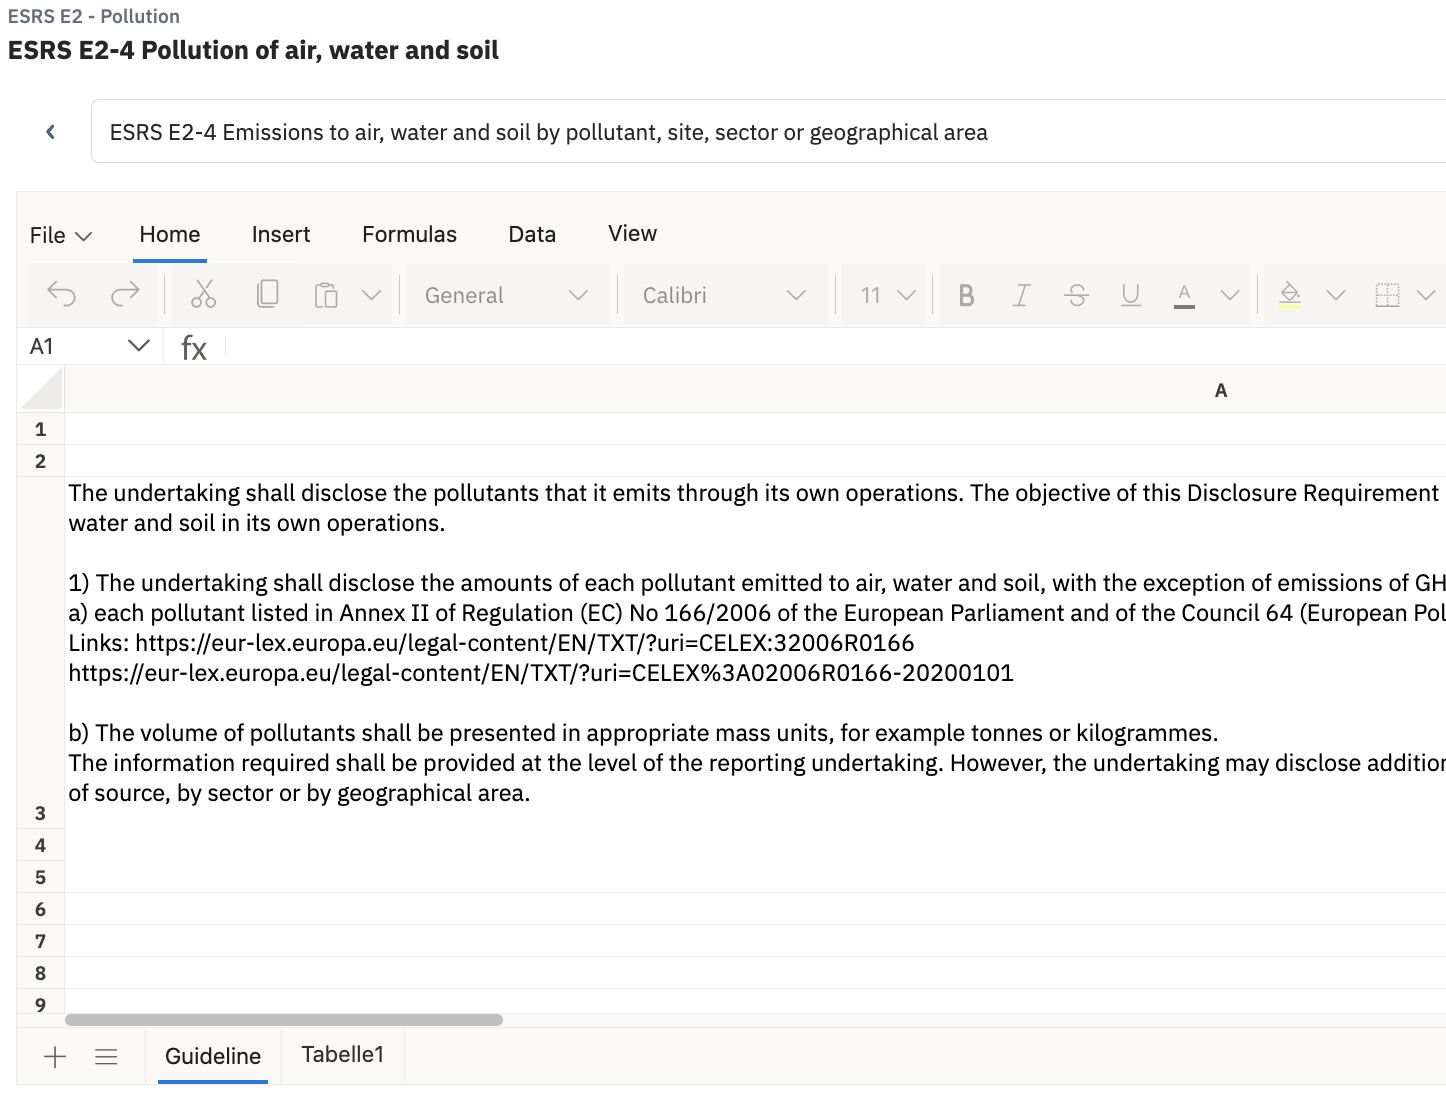
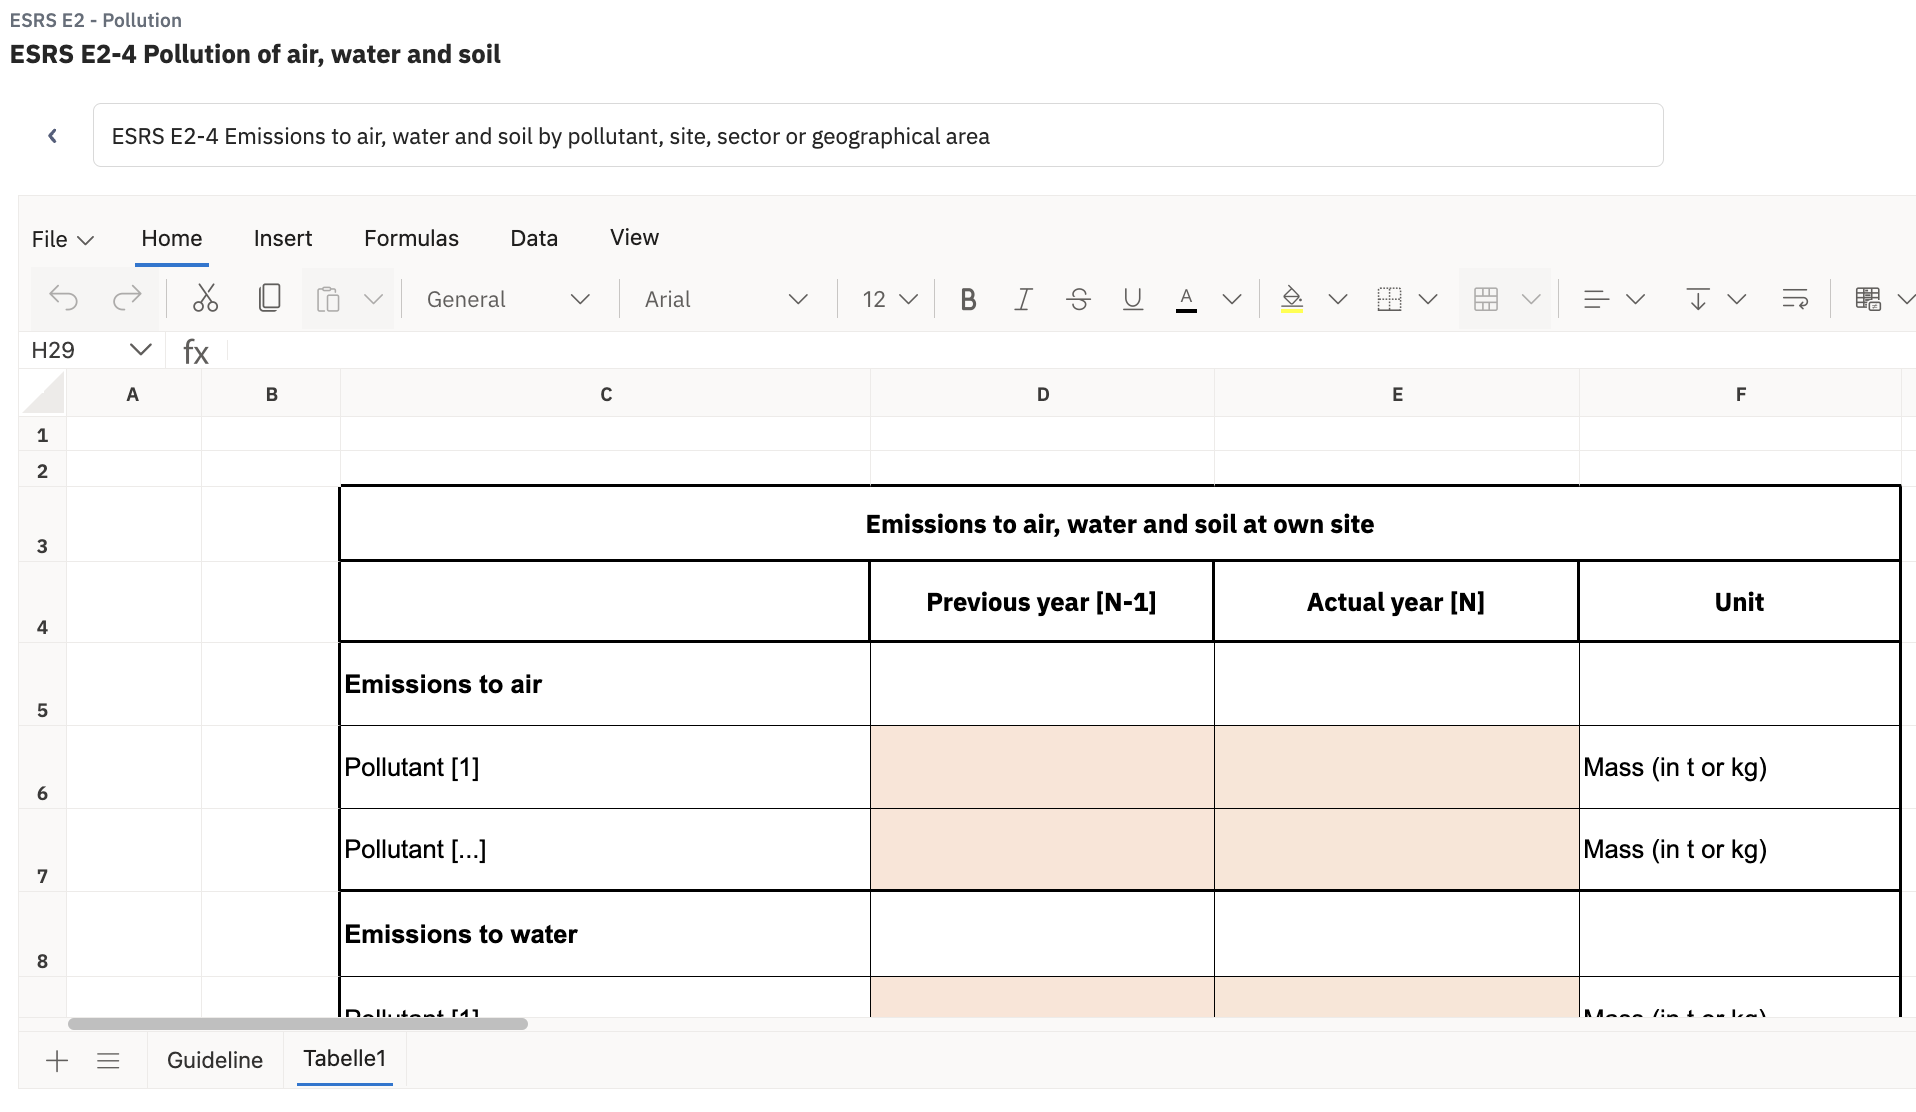
Second tab
You can enter your data in this tab. You will receive a sample table whose structure you can use for your data. Use the full-screen function to get a better overview of your data.
Further information on the corresponding indicator is available via the page navigation.
Creating diagrams and graphs
Create diagrams and graphs from your entered data. Use the functions provided above the table - also to visualize your table or to use calculation formulas.
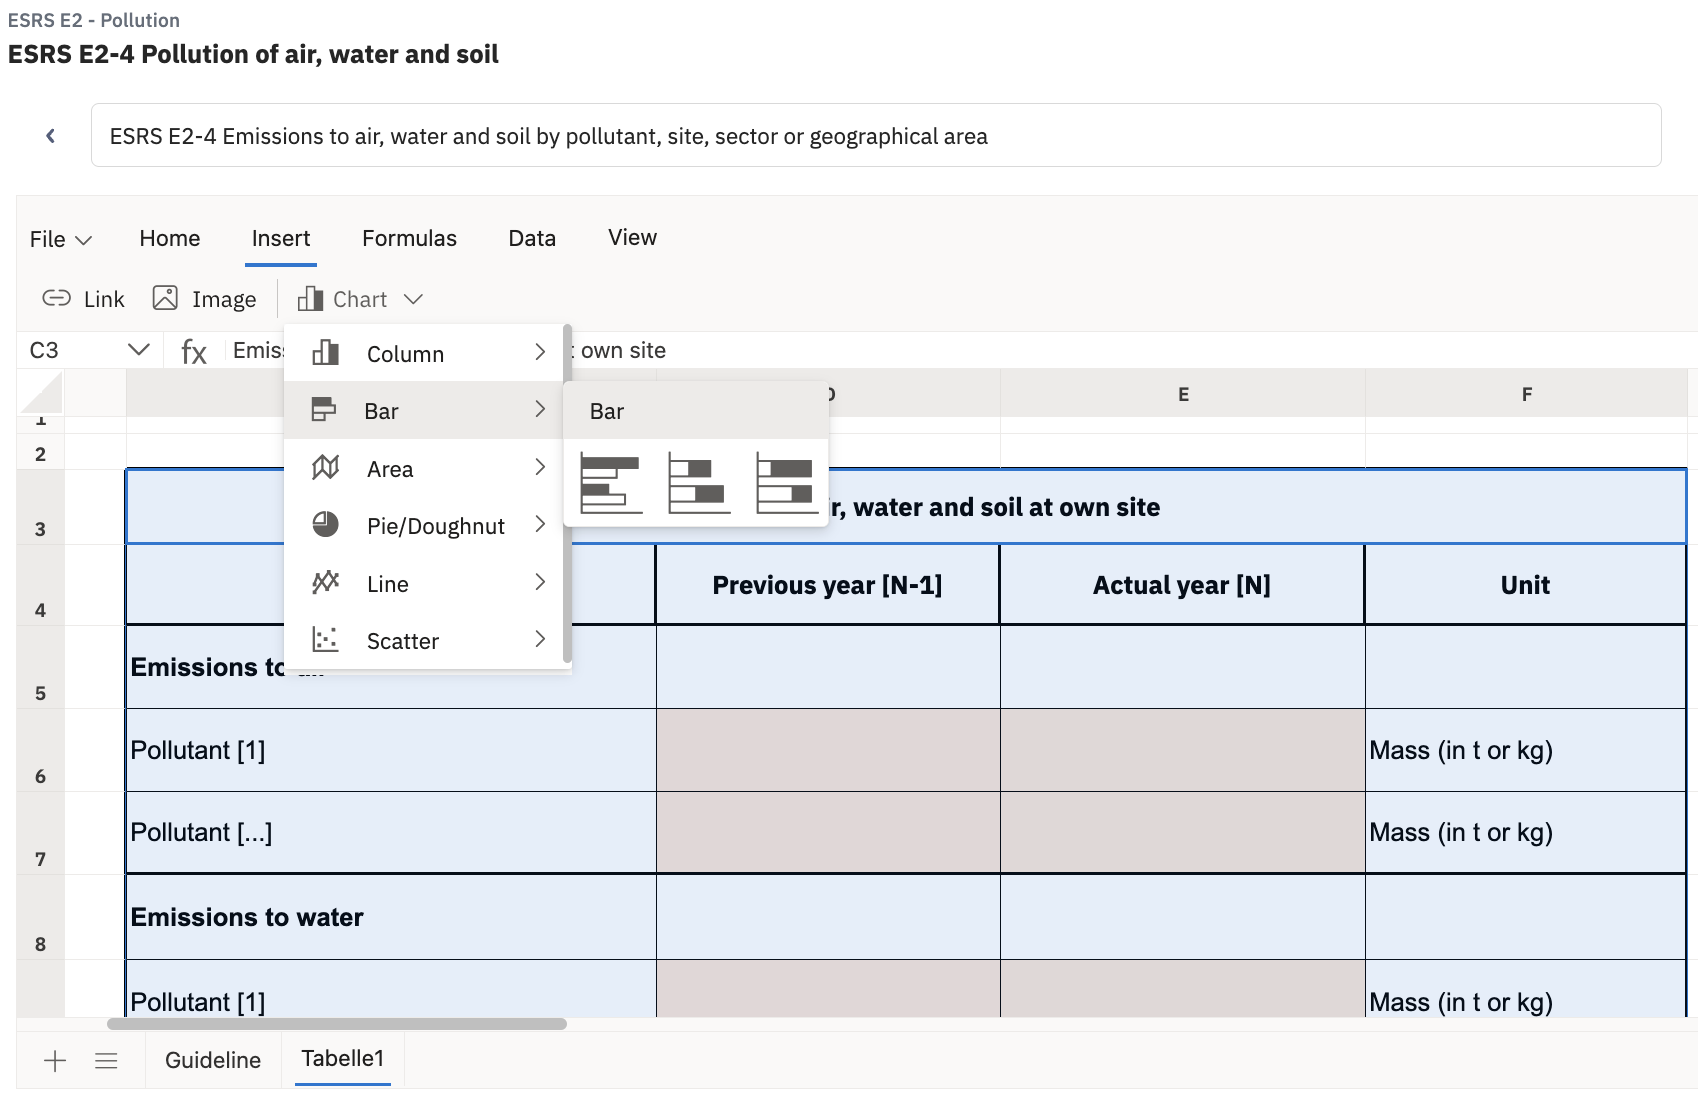
When creating your report, you can easily access the charts you have created by using the page navigator of the corresponding topic.
Adding new metrics
You can also create your own new (="empty") metrics for a topic or indicator using the "Add" button on the metrics overview. For this to be displayed in the overview, it must be assigned to an existing topic.
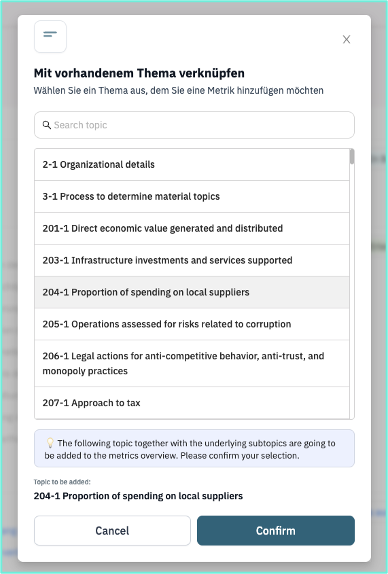
The linked topic or indicator now appears in the overview and you can access an empty representation of your metric via the "Add new metric" button. Now give your metric a name and save your content.
 Hat dies Ihre Frage beantwortet?😞😐😃


