After entering the consumption data, the data can be analysed via the "Analysis" tab in the top-level navigation. Various analysis options are available.
1. Selecting the Structural Element
In the first step, select the desired structural element using the dropdown menu. To the left, two checkboxes allow you to define whether subsidiaries of the structural element should be included:
-
Include sub-structure: Subsidiaries and sub-locations are included
-
Without sub-structure: Only the selected structural element is considered.
You can then perform analyses by Scopes, Categories or Locations, or view the emissions balance.

Analysis Types in Detail
Analysis by Scope
This view shows which of the three scopes accounts for the largest share of total emissions.

By clicking on one of the scopes, you can drill down one level to the category view of the selected scope.

Clicking again allows you to analyze emissions at the activity level within the chosen category. This enables you to move step by step from a high-level overview down to individual emission activities.

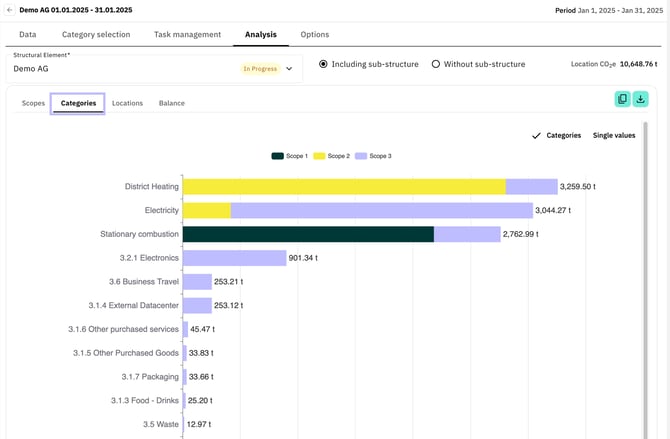
Analysis by Category
This view shows which categories generate the highest emissions within each scope. By clicking on one of the bars, you can directly access the activity level of the respective category. This allows you to identify emission drivers in a targeted manner.
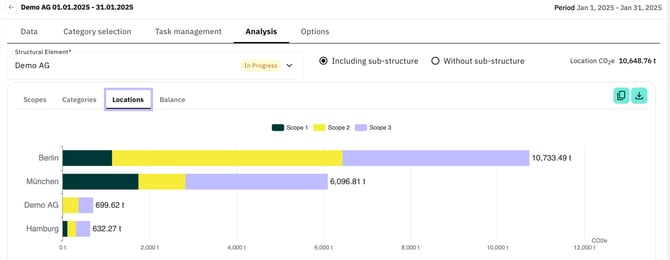
Analysis by Location
In this view, you can see which location generates the highest emissions.
Note: In this view, the option to include or exclude sub-structures is not available. All subsidiaries and locations are always included by default.
2. Exporting Data and Charts
The following export functions are available in the Scopes, Categories, and Locations tabs:
-
Using the Download button in the upper right corner, the respective chart can be downloaded as an image file.
-
Using the Copy button, the data behind the charts can be copied to the clipboard and then pasted, for example, into Excel.

3. Emissions Balance
In the "Balance" tab, the company's emissions balance is displayed. Emissions are shown by category and then aggregated into the respective scopes. For Scope 2 emissions and total emissions, both market-based and location-based emissions are calculated. The approach highlighted in bold - here market-based - corresponds to the approach selected by the company.
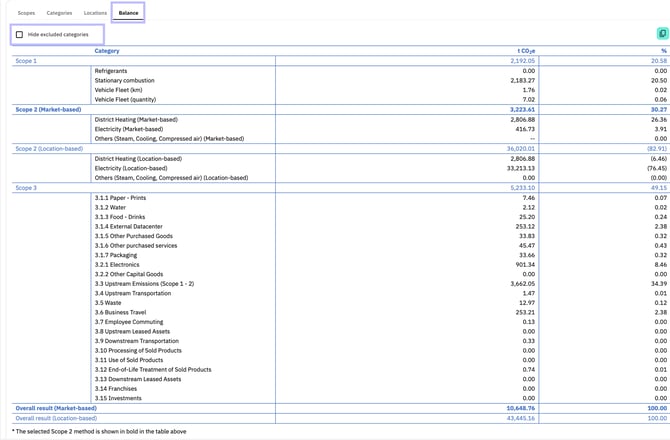
Using the "Hide excluded categories" checkbox, categories that were deactivated in the category selection can be hidden.
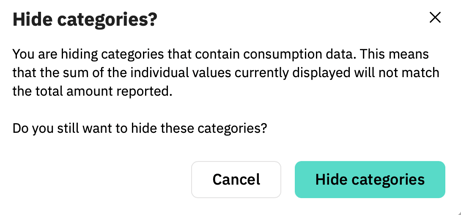
Note: If consumption data has already been entered for an excluded category, hiding the category does not change the total emissions balance. As a result, the sum of the visible individual values may not match the overall total.
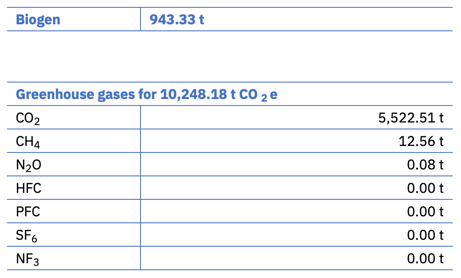
Additionally, outside of the balance table, the share of biogenic emissions and a breakdown of the included greenhouse gases, including their respective shares, is displayed.
All three tables can be copied to the clipboard using the Copy button and then pasted, for example, into Excel.