After entering the consumption data, it can be analyzed in the Climate Hub via the “Analysis” tab in the top-level navigation. Various analysis options are available there.
1. Analysis by Life Cycle Stages
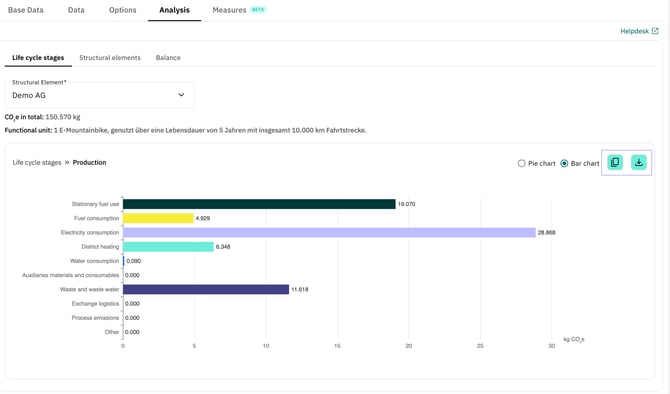
The view shows in which life cycle stage the product generates the highest emissions. This can help you define and implement targeted emission reduction measures.
Depending on the selected system boundary, different phases are displayed:
-
Cradle-to-gate: Raw material acquisition and production
-
Cradle-to-grave: All five life cycle phases
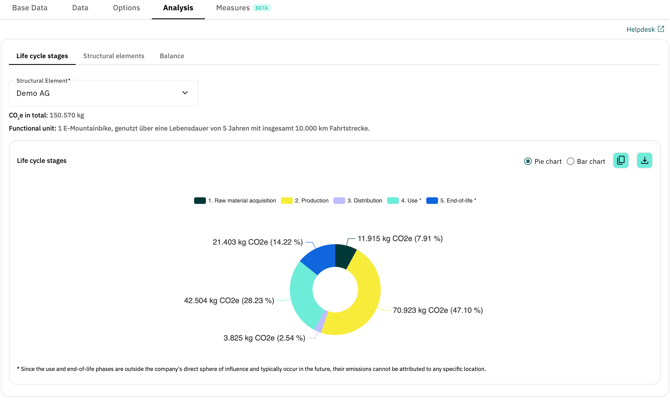
Navigation by Production Site
Using the “Structural element” dropdown, you can navigate between different production sites.
Note: Since the Use and End-of-life phases are independent of location, their emissions are displayed for all sites when using the Cradle-to-grave approach. A corresponding note is shown below the chart.
Drilldown: From Phase to Activity
The analysis is interactive and allows a step-by-step drilldown:
-
By selecting a life cycle stage, the corresponding sub-stages (Level 1) are displayed.
-
Selecting a Level 1 sub-stage opens the corresponding sub-stage (Level 2).
-
Selecting a Level 2 sub-stage takes you to the related activities.
You can switch between a pie chart and a bar chart in the upper right corner of the chart. The bar chart is particularly useful at the activity level, as it clearly lists all activities one below the other, making it easier to compare emission drivers.
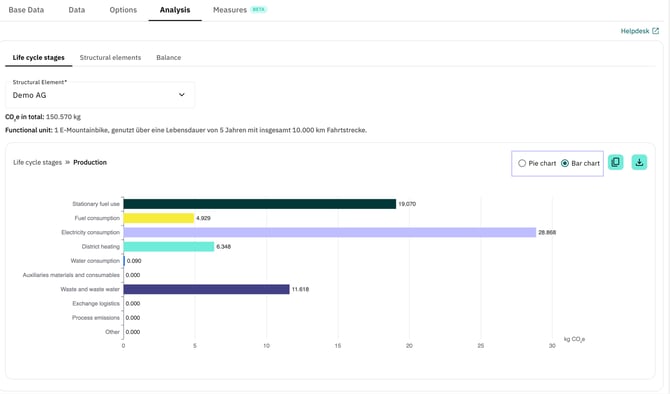
Using the navigation in the upper left corner, you can return to the higher-level view at any time.
Note: With a custom report configuration, the number of levels depends on the defined subphase structure. In the predefined report configuration, please note that the Use and End-of-life phases do not contain subphases.
2. Analysis by Structural Elements
In the "Structural elements" tab, you can see which structural element generates the highest emissions in each phase. Each structural element is displayed as a separate bar. Here as well, the display depends on the selected system boundary:
-
Cradle-to-gate: Raw material acquisition and production
-
Cradle-to-grave: All five phases
Note: Since the Use and End-of-life phases cannot be assigned to a specific location, an additional location-independent bar is added when using the Cradle-to-grave approach. A corresponding note is displayed below the chart.
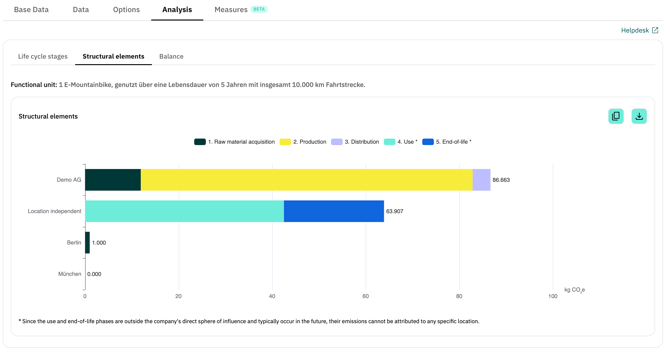
Drilldown within Structural Elements
A detailed analysis is also possible in this view:
-
Clicking on a life cycle stages opens the corresponding sub-stages (Level 1).
-
Selecting a Level 1 sub-stage displays the corresponding sub-stages (Level 2).
Using the navigation in the upper left corner of the box, you can return to the higher-level view at any time.
3. Exporting Data and Charts
The following export functions are available in the Life Cycle Stages and Structural Elements tabs:
-
Using the Download button in the upper right corner, the respective chart can be downloaded as an image file.
-
Using the Copy button, the data behind the charts can be copied to the clipboard and then pasted, for example, into Excel.
4. Balance
In the "Balance" tab, the following values are displayed for each structural element:
-
Emissions per stage
-
Emissions per sub-stage (Level 1)
-
Emissions per sub-stage (Level 2)
-
Total emissions
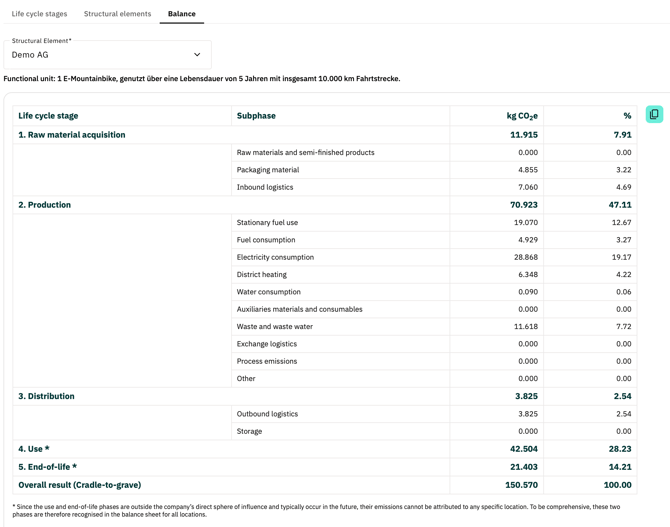
Note: Since the Use and End-of-life phases cannot be assigned to a specific structural element, their emissions are included in the balance of each site. A corresponding note is displayed below the table.
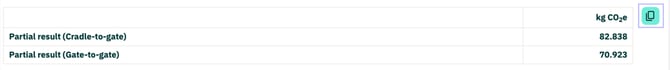
Partial Results by System Boundary
Depending on the selected system boundary, additional partial results are displayed:
For Cradle-to-grave
-
Gate-to-gate (Production)
-
Cradle-to-gate (Raw material acquisition and production)
For Cradle-to-gate
-
Gate-to-gate (Production)
Table Export
Both tables can be copied to the clipboard using the Copy button and then pasted, for example, into Excel.