![VERSO_Logo-1.png]](https://helpdesk.verso.de/hs-fs/hubfs/Globale%20Design-Elemente/VERSO_Logo-1.png?height=50&name=VERSO_Logo-1.png)
The Balance shows a product's CO₂e emissions broken down by life cycle stage and — where available — split into fossil and biogenic shares. This article explains how the table is structured and what the individual result rows mean.
Table Structure
Above the table, you see the total result in kg CO₂e as well as the declared or functional unit, that is, the reference quantity to which all reported emission values relate.
The balance is shown per structural element. Using the selection field at the top, you can switch between the structural elements of your report.
Within the table, emissions are broken down by life cycle stage. Which stages are displayed depends on the selected system boundary: for cradle-to-gate, these are Raw Material Acquisition and Production; for cradle-to-grave, Distribution, Use, and End-of-Life are added. Each stage is further divided into subphases. The kg CO₂e (excl. biogenic CO₂ uptake) column shows the emission value of the respective step, and the % column its share of the total result.
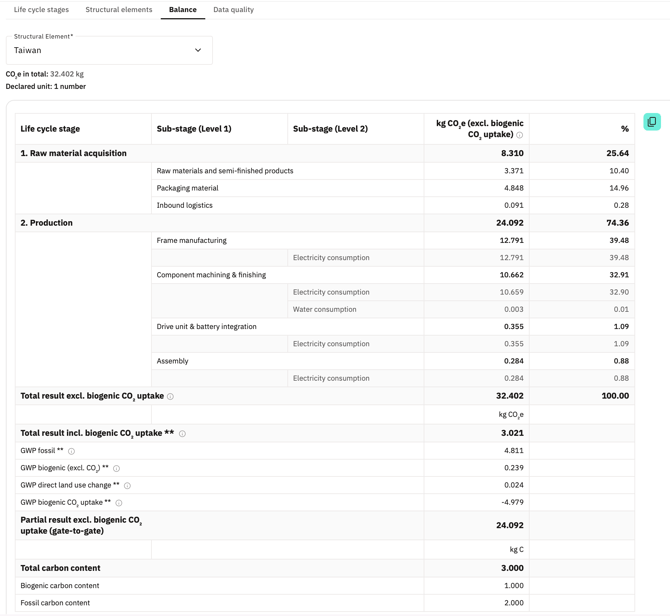
The result rows at a glance
In the lower part of the table, you find several summary result rows. Some of them are marked with a double asterisk (**). These are calculated only for activities whose emission factor comes from ecoinvent or for which a manual breakdown of the emission factors has been provided – see the note on data basis for more.
- Total result excl. biogenic CO₂ uptake – The sum of all emitted and removed GHG amounts, excluding CO₂ uptake through biomass.
- Total result incl. biogenic CO₂ uptake – The total result excl. biogenic CO₂ uptake plus the CO₂ uptake through biomass, which is removed during plant growth and stored in the product.
- GWP fossil – The share of global warming potential originating from fossil sources (e.g. combustion of fossil fuels).
- GWP fossil aircraft emissions - Separate reporting of the portion that stems exclusively from fossil fuel emissions from aviation. This factor therefore represents a subset of the “Factor fossil”.
- GWP biogenic (excl. CO2) – The share of global warming potential from biogenic sources excluding biogenic CO2. Includes biogenic non-CO₂ emissions such as biogenic methane.
- GWP emissions and removals from direct land use change – The share of global warming potential attributable to direct land use change (dLUC), e.g. converting forest into cultivated land. The GWP includes both emissions and removals from direct land use change. Emissions from indirect land use change are not included.
- GWP biogenic CO2 and CH4 emissions - The release of biogenic CO₂ and CH₄, which are released back into the atmosphere, for example, during the product’s use or disposal.
- GWP biogenic CO2 uptake - CO2 removed from the atmosphere during biomass growth and bound as biogenic carbon in the product, expressed in kg CO2e as a negative contribution (removal).
The sum of the biogenic CO₂ uptake and the biogenic CO₂ and CH₄ emissions represents the net balance of biogenic CO₂ and CH₄ flows. - Biogenic carbon content – The total amount of biogenic carbon (in kg C) bound in the product. Unlike the other result rows, this is not an emission, but a mass of carbon.
- Fossil carbon content – The total amount of fossil carbon (in kg C) bound within the product. Unlike the other result rows, this is not an emission, but a carbon mass.
- Total carbon content – The total amount of carbon (in kg C) bound in the product, that is, the sum of biogenic and fossil carbon content. This, too, is a carbon mass.
Result rows marked with * when cradle-to-grave system boundary is selected
The Use and End-of-Life stages, which appear when the cradle-to-grave system boundary is selected, are marked with an asterisk (*). The note beneath them explains that these two stages lie outside the company's direct sphere of influence and typically occur only in the future. Their emissions therefore cannot be attributed to a specific structural element. To ensure a complete balance, they are reported jointly for all structural elements.
Partial results by system boundary
Depending on the selected system boundary, additional partial results are displayed:
For cradle-to-grave
- Partial result excl. biogenic CO₂ uptake (cradle-to-gate)
- Partial result excl. biogenic CO₂ uptake (gate-to-gate)
For cradle-to-gate
- Partial result excl. biogenic CO₂ uptake (gate-to-gate)
Note on the data basis
The values marked with ** are calculated for all activities for which the corresponding emission factors are available. For a complete output of the above metrics, we therefore recommend either assigning an ecoinvent factor to the relevant activities or manually entering all emission factors. Activities for which such a breakdown is not available are not included in these rows.
Table Export
The table can be copied to the clipboard using the copy button and then, for example, pasted into Excel.