![VERSO_Logo-1.png]](https://helpdesk.verso.de/hs-fs/hubfs/Globale%20Design-Elemente/VERSO_Logo-1.png?height=50&name=VERSO_Logo-1.png)
To increase the significance and transparency of your product footprint, you can assess the data quality of your emission factors and activity data in Climate Hub. Based on these assessments, the system calculates two key indicators:
Data Quality Rating (DQR):
Describes how well the emission factors used reflect the actual situation – in terms of their temporal, geographical and technological representativeness as well as their precision.
Primary Data Share (PDS):
Describes what proportion of your activity data and emission factors is based on primary data.
You will find both indicators in the "Analysis" → "Data Quality" tab. Use the two checkboxes to switch between data quality rating and primary data share.
The feature helps you systematically document the quality of your data, make uncertainties in the CO2 footprint transparent, make the use of primary data visible, identify potential for improvement in your data collection, and meet the requirements of ISO 14067.
1. Recording the Assessment
You enter the assessments in two places:
- You record the type of emission factor as well as its temporal, geographical, technological representativeness and its precision when creating or editing an activity.
- You assess the data type of the activity directly in the data table via the "Data category" column.
Both indicators are then calculated from these inputs:
| Entry | Influence |
| Type of emission factor and activity | Primary data share |
| Representativeness and precision of emission factor | Data quality rating |
2. Data Quality Rating (DQR)
The data quality rating describes how well the emission factors used represent the actual situation. It is based exclusively on the assessment of the emission factors – the assessment of the activity data is not included.
2.1 Input: Representativeness and precision of the Emission Factor
For each emission factor, you can assess four dimensions – temporal, geographical and technological representativeness and precision – each on a scale from 1 (very good) to 5 (very poor).

Note: If no assessment is made, "Very poor" is assumed automatically.
Temporal representativeness - How good is the emission factor compared to the reporting year?
| Bewertungsstufe | Definition |
| Very good |
≤ 1 year |
| Good | > 1 year und ≤ 2 years |
| Fair | > 2 years und ≤ 3 years |
| Poor | > 3 years und ≤ 4 years |
| Very poor | > 4 years |
Geographical representativeness - How well does the region of the emission factor match the region under consideration?
| Bewertungsstufe | Definition |
| Very good | The emission factor comes from the same region as the process under consideration (e.g. site-specific data). |
| Good | The emission factor matches the same country, but not exactly the same region (e.g. country-specific average data). |
| Sufficient | The emission factor refers to a larger region, not a specific country (e.g. European average data). |
| Poor | The emission factor is based on global average values without regional differentiation (e.g. global database values). |
| Very poor | The origin of the emission factor does not match the region under consideration or is unknown. |
Technological representativeness - How well does the underlying technology of the emission factor used match the actual process?
| Bewertungsstufe | Definition |
| Very good | The emission factor is based on the same technology as the process under consideration, directly at the same site (e.g. when measured data from your own facility is used). |
| Good | The emission factor is based on the same technology, but not exactly at site level (e.g. data from another plant of the same company). |
| Sufficient | The emission factor is based on general industry average data, e.g. a database value. |
| Poor | The emission factor is based on a comparable technology, e.g. using a similar material or process. |
| Very poor | The technology underlying the emission factor does not match the real process or is unknown. |
Precision - How reliably does the emission factor used match the actual value?
| Bewertungsstufe | Definition |
| Sehr gut | Derived from collected process data and verified. |
| Gut | Derived from collected process data, unverified. |
| Ausreichend | Calculated or based on plausible assumptions. |
| Schlecht | Estimate based on expert judgement. |
| Sehr schlecht | Methodology or origin unclear. |
2.2 Calculation
For each structural element, a DQR is calculated for each of the four dimensions as a weighted average across all activities; the absolute CO2e values incl. biogenic CO2 uptake serve as the weight. The aggregated DQR is derived as the mean of the three dimensions:
Aggregated DQR = 1/4 (DQR temporal + DQR geographical + DQR technological + DQR Precision)
Important: If no value including biogenic CO₂ is provided for an emission factor, the analysis uses the corresponding value excluding biogenic CO₂ as a fallback value. The use of a fallback value may result in a calculation that deviates from the ISO 14067-compliant methodology.
2.3 Results
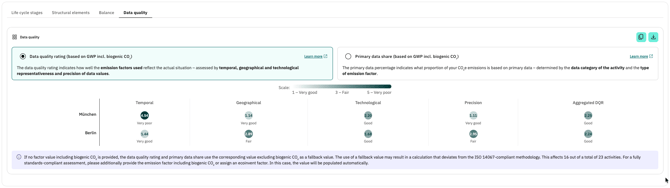
The results of the data quality rating are displayed as a table per structural element. The three dimensions (temporal, geographical, technological) and the aggregated DQR are shown. Each value is on a scale from 1 (very good) to 5 (very poor); the color of the circles reflects the classification on this scale. A low value (close to 1) shows that your data represents the actual situation well. A high value (close to 5) indicates insufficient representation or missing information – here there is potential for improvement, e.g. through the use of more up-to-date or more site-specific data.
3. Primary Data Share (PDS)
The primary data share describes what proportion of your data is based on primary data. It is calculated from the type of emission factor and the data type of the activity.
3.1 Input: Type of Emission Factor
The type of emission factor determines whether the emission factor is considered primary. Only a supplier-specific emission factor is considered primary and is therefore included in the calculation of the primary data share.

| Type | Description |
| Supplier-specific EF | Emission factor comes directly from the supplier |
| Activity-based EF (database) | Emission factor comes from a database and is based on physical quantities |
| Spend-based EF (database) | Emission factor comes from a database and is based on spend |
| Unknown / Other | Origin or methodology of the emission factor unclear |
For a supplier-specific emission factor, you can enter the exact primary data share manually in the "Primary data share" field.
Note: If no type is specified, "Unknown / Other" is assumed automatically, which results in a primary data share of 0%.
3.2 Input: Data Type of the Activity
You assess the data type of the activity in the data table via the "Data type" column. It indicates whether the data is primary or secondary. Only activity data classified as primary is included in the primary data share.
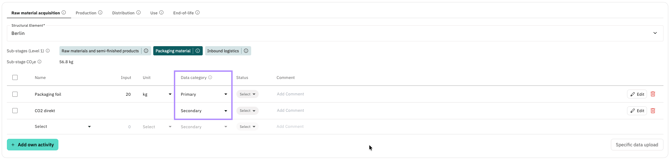
| Data type | Description |
| Primary | Activity data is based on primary data |
| Secondary | Activity data is based on secondary data |
| Old | New |
| Very good | Primary |
| Good | Secondary |
| Sufficient | Secondary |
| Poor | Secondary |
| Very poor | Secondary |
After the migration, please check whether the transferred values correctly reflect your data and adjust them manually if necessary.
3.3 Calculation
- The activity is classified as primary.
- The emission factor is a supplier-specific EF.
- The supplier's primary data share is specified in the corresponding field.
The primary data share across all activities is calculated as an emission-weighted average – activities with higher emissions have a greater influence on the result. Negative emissions are included with their absolute contribution in the calculation, so that both positive and negative emissions are weighted correctly. Otherwise, in extreme cases, the primary data share could fall below 0 % or exceed 100 %.
Important: If no factor value including biogenic CO₂ is provided, the data quality rating and primary data share use the corresponding value excluding biogenic CO₂ as a fallback value. The use of a fallback value may result in a calculation that deviates from the ISO 14067-compliant methodology.
3.4 Results
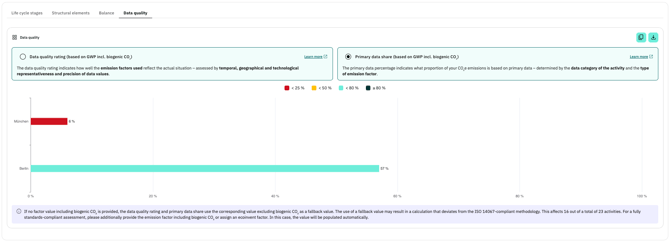
The primary data share is displayed per structural element as a horizontal bar chart. The colors show at a glance which range the primary data share is in:
| Colour | Range |
| Red | < 25 % |
| Yellow | < 50 % |
| Turquoise | < 80 % |
| Green | > 80% |
A high primary data share shows that your footprint is based on a large proportion of real, reliable data and therefore has a high level of transparency. A low primary data share, on the other hand, indicates that databases or estimates were predominantly used, or that no information on the primary data share was provided – here there is potential for improvement in data collection.