![VERSO_Logo-1.png]](https://helpdesk.verso.de/hs-fs/hubfs/Globale%20Design-Elemente/VERSO_Logo-1.png?height=50&name=VERSO_Logo-1.png)
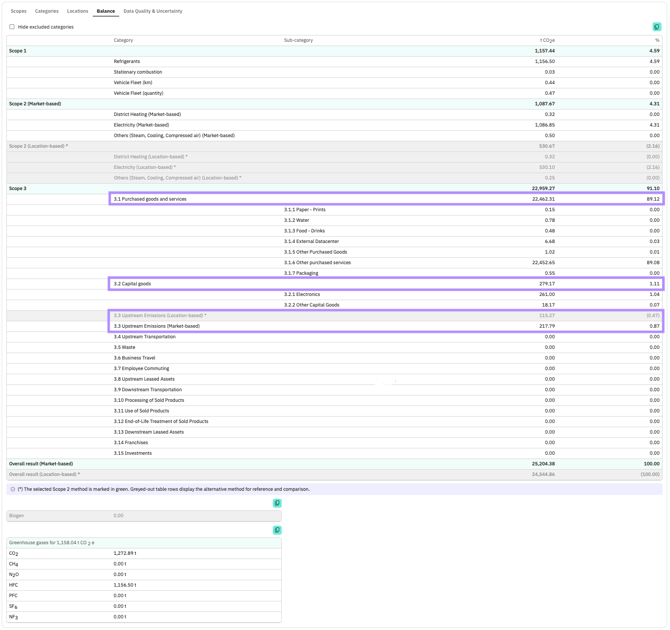
The Analysis → Balance tables have been redesigned to make CO2e emissions data easier to understand, compare, and interpret.
What's new?
- Refreshed design: The table features a new layout and updated color scheme for improved readability.
- Clear method indication: The currently selected Scope 2 method (Location-based or Market-based) is highlighted in green, while the alternative method is displayed in grey.
- Expanded Scope 3.3 visibility: Upstream emissions (Scope 3.3) are now shown for both Location-based and Market-based calculations in the same table. The non-selected method remains visible but is greyed out.
- Summed values for Scope 3.1 and 3.2: Total emissions are now displayed for all sub-categories within Scope 3.1 and Scope 3.2.
Benefits
- View indirect emissions from Location-based and Market-based calculations in one table—without switching between views.
- Compare both Scope 2 methods at a glance: clearly identify the active method, while keeping the alternative method visible for reference. The improved visual distinction between active and reference values makes comparisons easier and reduces the risk of misinterpretation.
- Better understand which values are currently relevant through improved visual guidance:
- The greenhouse gas breakdown follows the selected Scope 2 method and only displays the values relevant for the active calculation.
- The biogenic emissions table follows the selected method logic and is populated only when Location-based is selected.
- See aggregated totals for Scope 3.1 and Scope 3.2 while retaining access to detailed sub-category values.