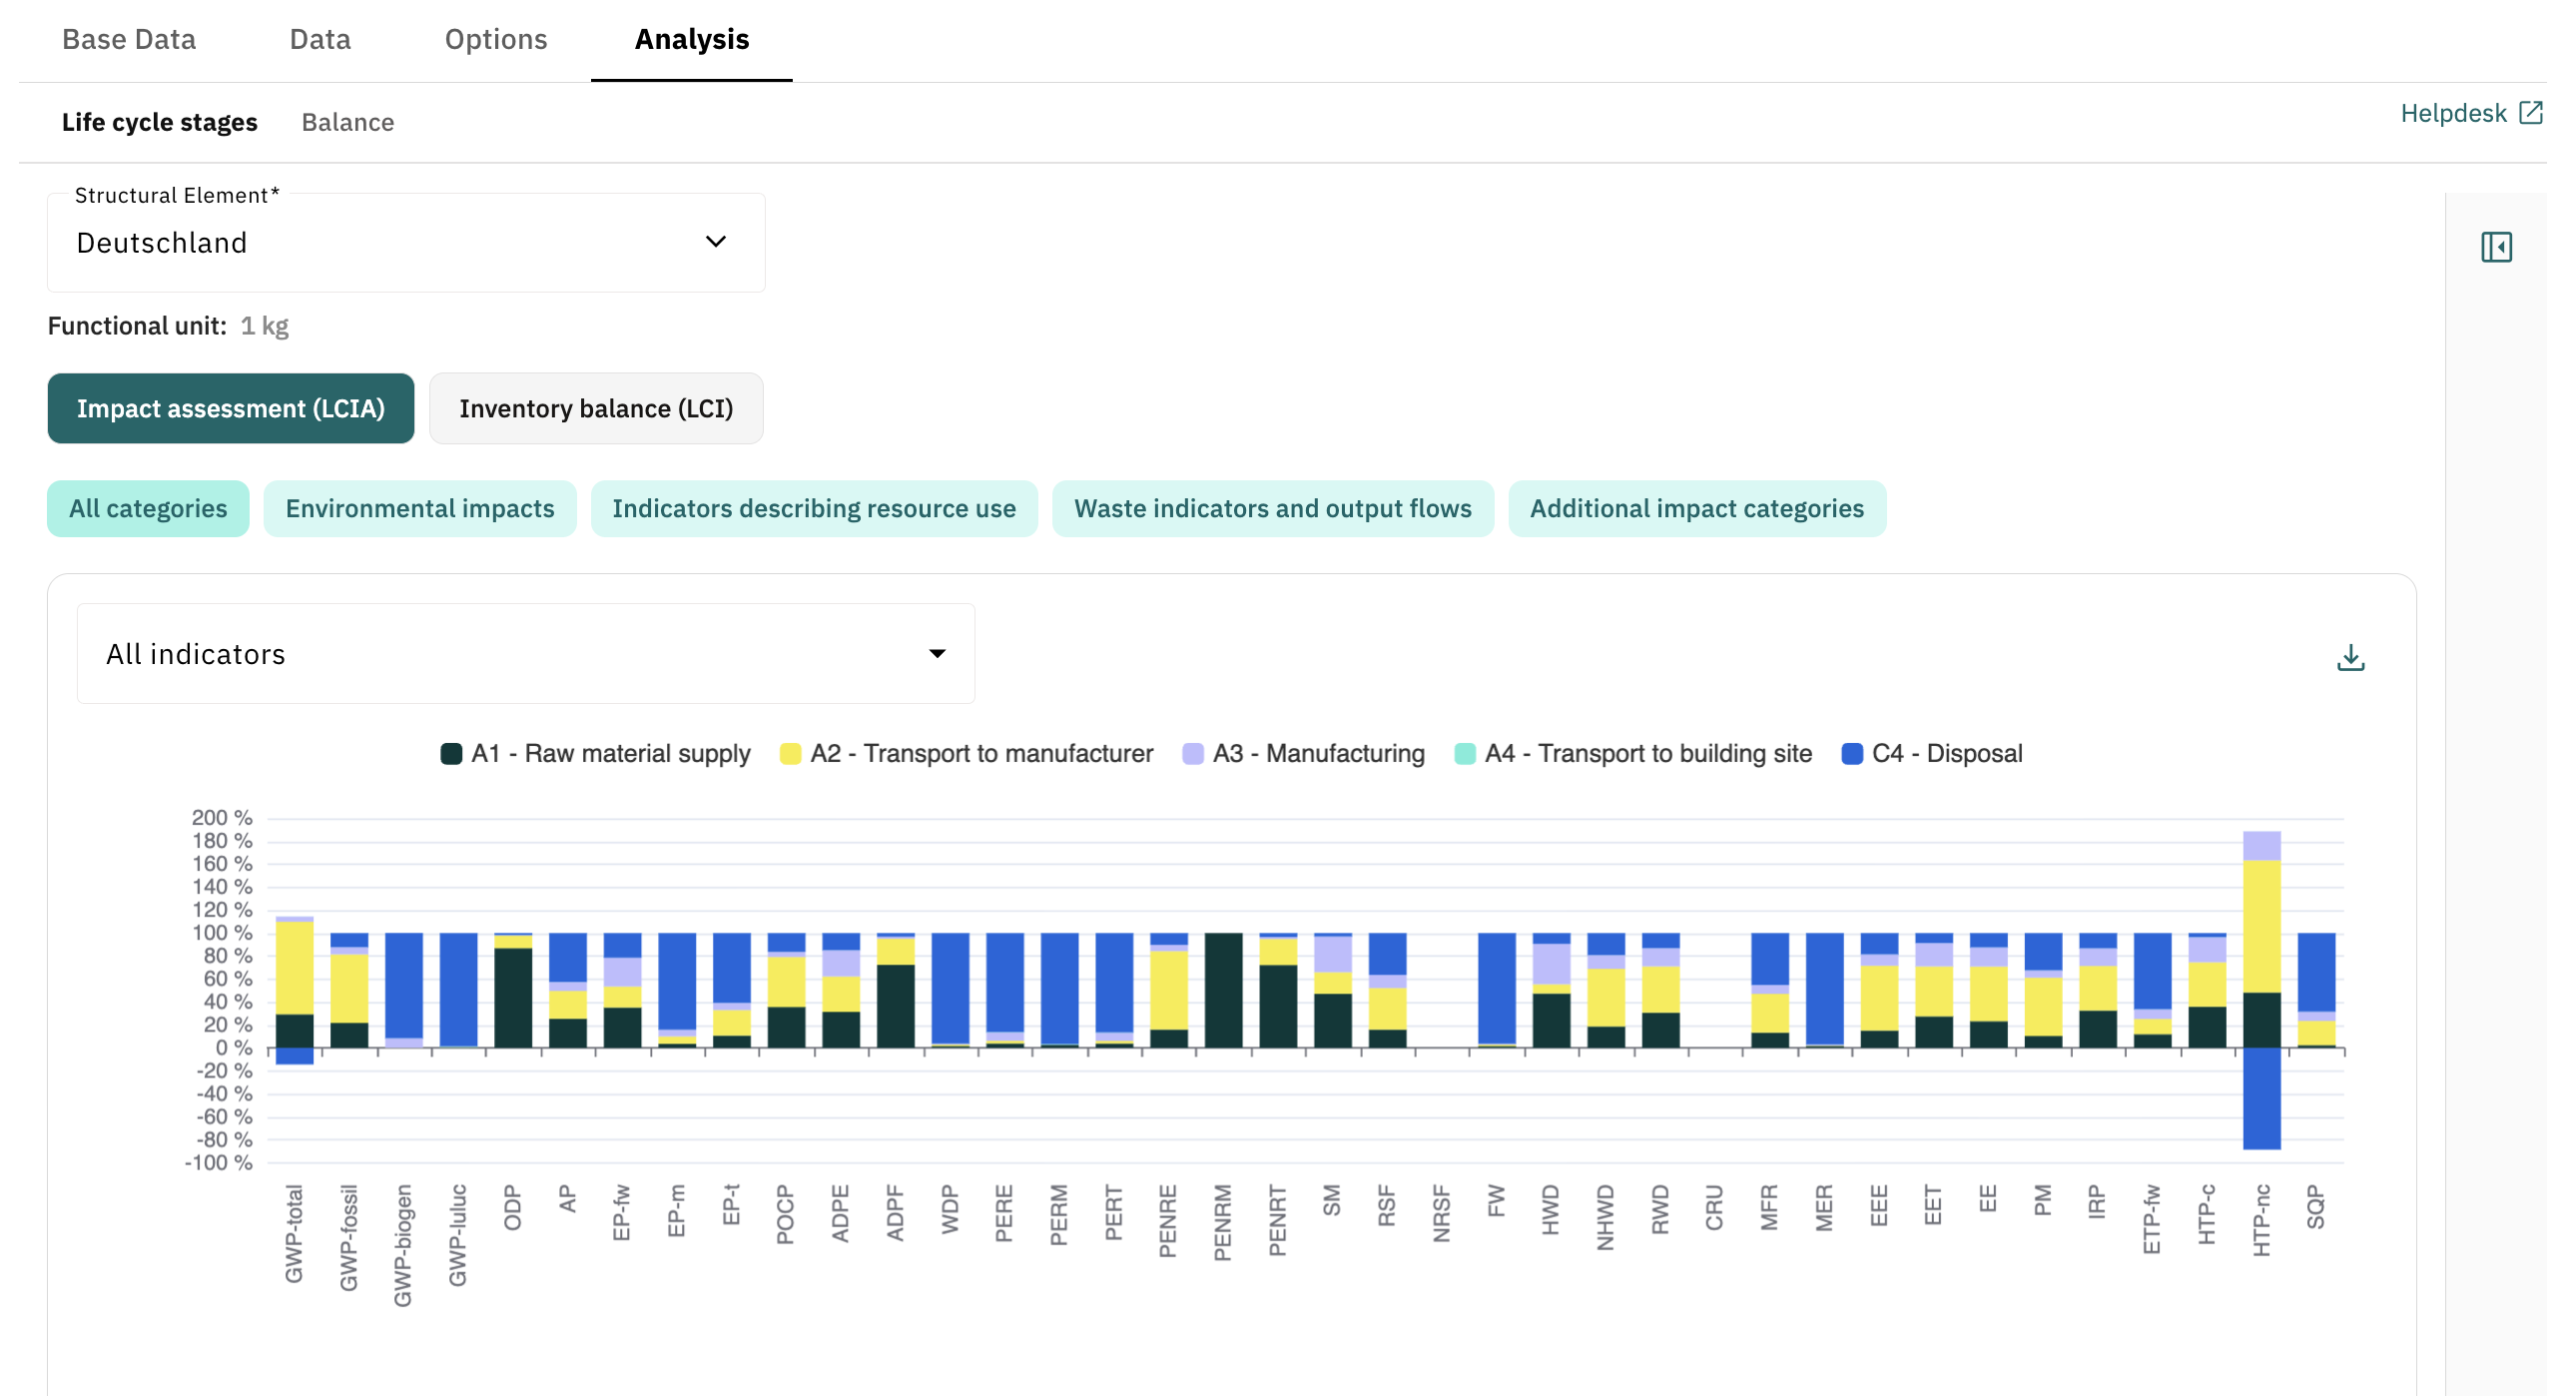
From now on, you can evaluate the results of your LCA report more easily in the new Analysis tab. The analysis shows which life cycle stages contribute most to the individual impact indicators and in which stages relevant environmental impacts occur.
In the Life cycle stages view, you can see at a glance how positive and negative contributions are distributed across the stages. In the Balance view, you can also see the absolute values for each indicator and life cycle stage in table format.
Filters for Impact assessment (LCIA), Inventory balance (LCI), categories and individual indicators help you focus on the results that are relevant to you. Charts can be downloaded as an image, and table data can be copied directly.
Detailed instructions can be found in the Helpdesk article.